Friday, 30 March 2018

Monthly Update


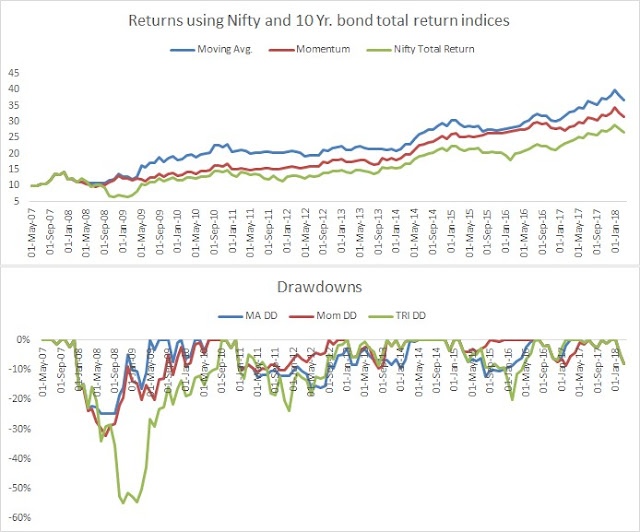
Updated figures for the equity-bond rotation models as on end March’18.

Data set: Nifty Total Returns Index & S&P BSE India 10 Year Sovereign Bond Index

Note: This does not include commissions, slippage & taxes.

I first wrote about these here:


The Moving average model switched to cash in end March 2018
The Momentum model is still invested in Nifty total returns index since end February 2017

Stats:


Sector Momentum Update


Updating the short-term momentum model for the week ending 28th March 2018.

Note: This does not include commissions, slippage & taxes.


Friday, 23 March 2018

Technicals for week ending – 23rd March 2018.


Note : This is not a recommendation and I am not a registered analyst, these are just data points and an assesment of the positives and negatives from a longer term point of view.

Nifty Weekly

Subjective: the longer term bearish picture stays the same as written here and here the charts got uglier.

On the rules-based front, closed below the stops. I overrode it as I used to wait for the weekly closing, but with that gap down it was a low probability of stops getting saved sooooo...I Hit the eject button today! It can trigger a buy next week or the week after that & have to jump in if triggers, that’s the way it is.


Saturday, 17 March 2018

Technicals for week ending – 16th March 2018.


Note : This is not a recommendation and I am not a registered analyst, these are just data points and an assesment of the positives and negatives from a longer term point of view.

Nifty Weekly

Chart 1. Not much to add here as previous posts highlighted the bearish developments. Just updating the charts for the week. Although still no close below the 40 week moving average BUT it was above for more than a year so now preparing for some whipsaws here.


Chart 2 Nifty total returns/10 year Bond index ratio is above its 40-week MA & momentum also favours Nifty index, indicating longer term outperformance for Nifty vs bonds.

Chart 3 Longer term intermarket strength as per the RS matrix is in IT, Realty & Media. With Auto, Infra and Pharma at the bottom.

Chart 4 Majority of indices are below their 40-week MA.

Chart 5 Avg. & Median distance of all sectors from their 52-week closing high is at -10.3% & -10.8%.

Chart 6 FII flows in Index futures segment is negative.


Sector Momentum Update


Updating the short-term momentum model for the week ending 16th February 2018.


Saturday, 10 March 2018

Technicals for week ending – 9th March 2018.


Note : This is not a recommendation and I am not a registered analyst, these are just data points and an assesment of the positives and negatives from a longer term point of view.

Nifty Weekly

Continuing with the bearish theme I wrote about last month the past few weeks have seen further damage in broader and sector indices. Considering the data post the 2008 crisis, similar themes are emerging which leads one to believe that 2018 has a high probability of playing out like 2011, 2013 & 2015. I repeat again, this is just a probability thing and keeping in mind the evidence. As for me, I continue to stick to my simple weekly & monthly models and yes, it is testing my patience.
All charts are posted below the write up.

In the first chart the damage is evident with majority of sector and broader Indices trading below their 40 week moving average. Moving on to chart two, this measure the average and median distance of the sector Indices from their highest 52 week close, the readings stand at -10.4% & -11% respectively. Finally, in charts 3 & 4 one can see that day to day & Intraday volatility has picked up as we are now seeing more days with a more than 1% gain or loss and are also witnessing more days with a 1% swing from Intraday high to low in the Nifty. Seeing these charts in relation to one another suggests a similar environment to 2011, 2013 & 2015 – majority of Indices trading below their 40 week moving average, average decline from 52 week highs in double digits and uptick in day to day and intraday volatility.

Moving on to client positioning in the derivatives space, the client category is net long in index futures and the long puts to long calls ratio is at 0.92 suggesting that clients hold more long calls than puts. This shows a clear bullish bias in the index derivatives space and historically when clients are this long the next few weeks have seen higher volatility and a bearish bias in Nifty. I have also put in the historical positioning going back to 2012 and it is in percentage terms i.e. the net long contracts are represented as a percentage of total index futures open interest. Though there are few instances since 2012 but it is evident that when clients go net long in index futures the following days have seen a negative Nifty. Lastly, the Nifty has seen 6 red weekly bars so there could be some short term respite within the next 2-3 weeks or maybe it’s the gamblers fallacy 😊


Sector Momentum Update

Updating the short-term momentum model for the week ending 09th February 2018.