Sunday 26 April 2015

Sector Technicals for the week ending – 24th April 2015.

Nifty Weekly Technical Analysis:
The Nifty closed below its first crucial support zone of 8550-8600 and for the medium term the trend seems to be negative as long as we trade below this zone. On a longer term basis, the 8150-8200 zone remains a major support. If that breaks then the longer term uptrend would become suspect and we also closed just 11 points below the 40 week moving average – so there seems to be a lot confluence of price support plus moving average support in the 8150-8200 zone, that is why I think these are important levels for the longer term trend. On the flows front, the India VIX closed around the 19% zone which is very alarming. Also, FII’s have reduced net longs in the index futures space and are well hedged via long positions in index put options.  


Sector Technicals:

CNX Midcap and Smallcap: The small and mid-cap indices respective RS lines performed well relative to the Nifty suggesting continued outperformance. However, both the indices closed below their 1st support zones just like the Nifty and are now at their 2nd support areas. A break below these supports and a close below 40 week moving average would be trouble for the longer term.


CNX Auto: As mentioned before, the Auto index’s first hurdle is going to be clearing the 9000 levels. Relative to the Nifty, it looks difficult to outperform as the RS line is not making new highs and seems to be reverting to its 40 week moving average. 8000 is going to be an important medium/long term support for the Auto index.

 
Bank Nifty: The banking index showed some strength for a day or two but its chart is also very similar to the Nifty in terms of closing near supports and 40 week moving average. The next 2-3 weeks are going to decide the longer term trend for banking stocks. RSI has closed below 50 after a very long time..watchout.


CNX Pharma: The Pharma index took a beating last week and as mentioned before, the 13000 level holds the key for a sustained uptrend, better to reduce long exposure for some time till we get 2 weeks of continuous closing above the 13000 mark.


CNX FMCG: The RS line for the FMCG index is holding supports while the index is just at its resistance. Still it would be better to wait and watch before adding to longs. 


CNX IT: The IT index took out its second support zone last week and closed below its 40 week moving average. I would be a buyer only above the 40 week moving average..but hey that’s just me !


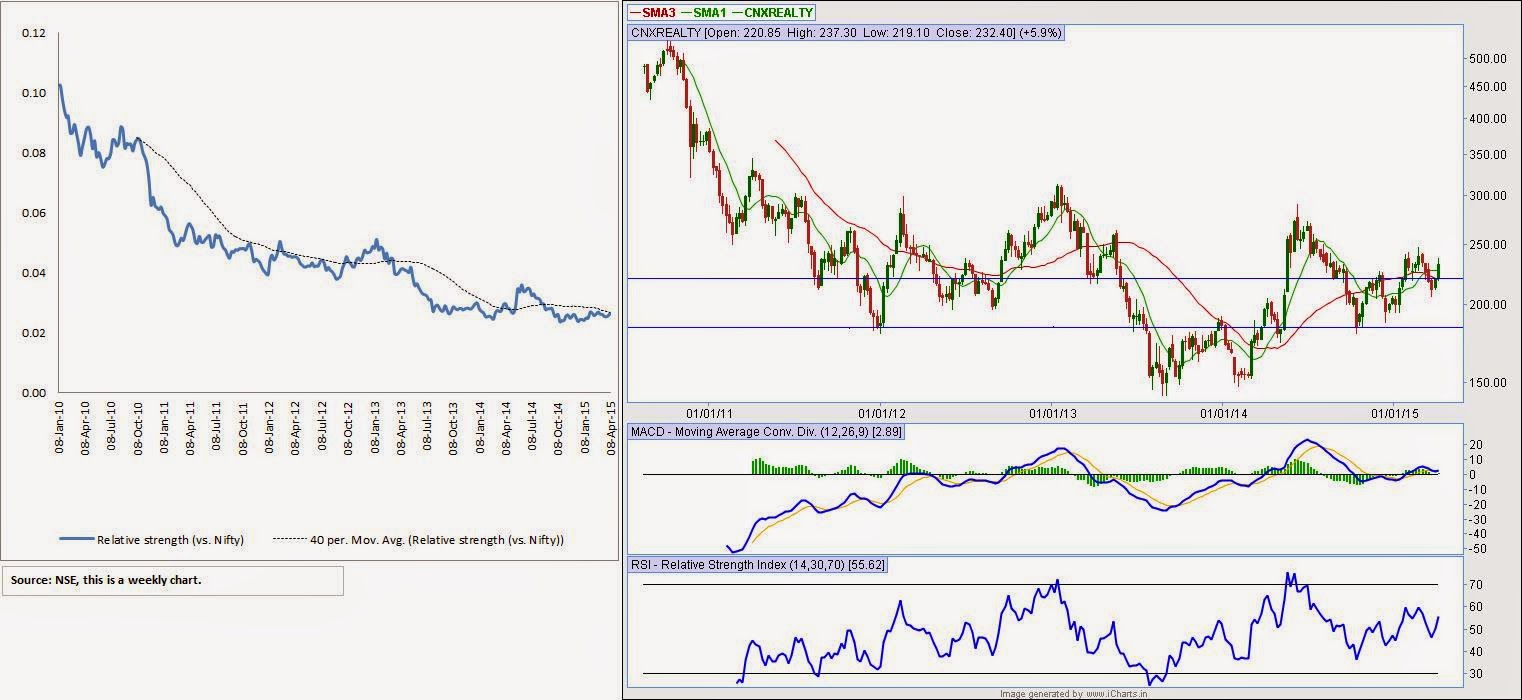
CNX Infra, Metal, Energy & Realty: Energy and Realty still have quite some overhead resistance, Infra looks best of the lot while the Metals space just closed above an important resistance and seems to be breaking out of a downtrend. However, it’s best to be long only once they are above their 40 week moving average. Currently only Infra is trading above its 40 week MA’s but has moved back below resistance – nothing seems to be going well for these 4 indices.


The below table is just a scan that I run to check the overall trend of an index and its performance vs. the benchmark Nifty. For more information on relative strength please click on the Relative Strength section above.


Monday 20 April 2015

Sector Technicals for the week ending – 19th April 2015.


Nifty Weekly Technical Analysis:
The Nifty closed in the crucial support zone of 8550-8600. For the medium term the trend seems to be positive as long as we trade above the 8550-8600 zones. Although there could be a lot of back and forth around this zone. One will have to be quick to get in and out of positions. On a longer term basis, the 8150-8200 zone remains a major support. If that breaks then the longer term uptrend would become suspect. On the flows front, the India VIX closed around the 15% zones which is not alarming. Also, we have not seen any build-up of short positions by FII’s in the index derivatives space. However, they seem to be well hedged via long positions in index put options.  


Sector Technicals:
CNX Midcap and Smallcap: The small and mid-cap indices respective RS lines performed well relative to the Nifty suggesting continued outperformance. However, the Mid-cap index is just at supports for a positive short to medium term outlook it would be imperative that the Mid-caps hold the 13200-13300 zone.


CNX Auto: The Auto index’s first hurdle is going to be clearing the 9000 levels. Relative to the Nifty, it looks difficult to outperform as the RS line is not making new highs and seems to be reverting to its 40 week moving average. 8000 is going to be an important medium/long term support for the Auto index.

 
Bank Nifty: The banking is near important levels both on the price as well as relative charts. Price wise, the important support zones for the banking index are in the 17700 to 18000 zone which also is the current 40 week moving average!. While relative to the Nifty, the RS line is just near its 40 week MA and around its prior highs of Apr’13. Price action over the next few weeks would be important to see in the banking space as that could possibly be an indication for the Nifty too.  


CNX Pharma: The Pharma index took a beating last week and as mentioned before, the 13000 level holds the key for a sustained uptrend and the index closed below that. Expect some back and forth around the 13000 mark for the coming weeks, OR better to reduce long exposure for some time till we get 2 weeks of continuous closing above the 13000 mark.


CNX FMCG: The RS line for the FMCG index is holding supports while the index is just at its resistance. Still it would be better to wait and watch before adding to longs. 


CNX IT: The IT index closed a tad bit below its 1st support zone near 11900 while the next support zone lies at around 11500. Price action over the next few weeks would be important to watch before increasing longs. Sometimes it is just better to do nothing, let the price action be a guide.  


CNX Infra, Metal, Energy & Realty: Interesting price action in the 4 indices over the last week. While Energy and Realty still have quite some overhead resistance, Infra looks best of the lot while the Metals space just close above an important resistance and seems to be breaking out of a downtrend. However, it’s best to be long only once they are above their 40 week moving average. Currently Infra and Realty are trading above their 40 week MA’s.


The below table is just a scan that I run to check the overall trend of an index and its performance vs. the benchmark Nifty. For more information on relative strength please click on the Relative Strength section above.


Sunday 12 April 2015

Sector Technicals for the week ending – 12th April 2015


Nifty Weekly Technical Analysis:

The Nifty gained more than 2% for the week and moved comfortably past its resistance zones. The key point to note is that most of the indices saw strong price action for the week, especially the Mid and Small cap indices broke out to new all-time highs – Could that be a sign of a new all time high on the Nifty too?. On the derivatives side, FII’s have increased net longs in index futures and have added significantly to net longs in index call options. I mentioned last week to be long since my rule is to stay long above the 40 week moving average and that played out well. Looks like the index is heading to its next resistance zone near 9000. A lot of sectoral indices have shown strong gains during this week – This price action across the board and Nifty moving past its resistance zones with ease suggests a positive outlook over the next few weeks.


Sector Technicals:

CNX Midcap and Smallcap: The small and mid-cap indices broke out to new highs while their respective RS lines too performed well relative to the Nifty. I believe as long as both these indices trade above supports and perform well, it’s an overall positive for the Nifty too!. Both the Indices are in uncharted territory and there’s no way to tell where they will pause.  Momentum wise, both have 14 week RSI readings of below 70, so there is a possibility of seeing more momentum in these indices.


CNX Auto: The Auto space held up well, but its first hurdle is going to be clearing the 9000 levels. Relative to the Nifty, it looks difficult to outperform as the RS line is not making new highs and seems to be reverting to its 40 week moving average.

 
Bank Nifty: The banking index moved back above its support zone of 18200. However, the RS line has not performed well over the past few weeks signalling some underperformance of the banking space. As long as the RS line trades above its 40 week MA, banking could be an outperformer relative to the Nifty.


CNX Pharma: As mentioned before, the Pharma index looks to be the only bright spot amongst other indices. The MACD is in buy mode and RSI is overbought but the index could stay overbought for long periods as it did before. Price action wise, the index has closed well above 13000. Holding 13000 would be key to a sustained uptrend.


CNX FMCG: The FMCG index came back with a vengeance!. The RS line is holding supports while the index is just at its resistance. Still it would be better to wait and watch as other sectors are offering better outperformance opportunities.  


CNX IT: The IT index held its important support zone near 11900. The RS line too is showing signs of outperformance as its holding above its 40 week MA. The trend is positive for the IT space as long as it holds above 11900.


CNX Infra, Metal, Energy & Realty: All the 4 indices saw good price action after a long period of time. While Energy and Realty still have quite some overhead resistance, Infra looks best of the lot while the Metals space just close above an important resistance and seems to be breaking out of a downtrend. However, it’s best to be long only once they are above their 40 week moving average. Currently Infra and Realty are trading above their 40 week MA’s.


The below table is just a scan that I run to check the overall trend of an index and its performance vs. the benchmark Nifty. For more information on relative strength please click on the Relative Strength section above.


Monday 6 April 2015

Sector Technicals for the week ending – 5th April 2015.

Nifty Weekly Technical Analysis:

The Nifty made up some of its losses in the last week and is placed around a lot of trendlines and in between supports as shown in the below chart. The MACD indicator is still in sell mode, while the 14 week RSI bounced back above 50. On the flows front, there was marginal net buying in index futures from FII’s – looks like a wait and watch approach. On the derivatives side, the India VIX is just at 13.67% - that seems like a very low level just before an RBI monetary policy meet !! – is the options market signalling continued strength in the market? Though we are still long as the Nifty is above the 40 week moving average, price action wise it STILL looks like we are in for some tough times ahead as we are in a confluence zone of supports and trendlines – The upside will look more convincing once these higher resistance zones are taken out. Also, the Index is above second major support zone of around 8150-8180.