Note : This is not a recommendation and I am not a registered analyst,
these are just my observations and an assessment of the positives and negatives
from a longer term point of view.
Nifty Weekly
Still
sticking to a broader theme of a consolidation with a positive bias as
mentioned in the previous weekly posts. On a longer-term time-frame data still
suggests to keep a positive stance on Nifty. Exit rules – weekly close
below 40-week MA or monthly close below 10-month MA.
Observations
(charts below):
Chart 1 Some global context here – on the weekly charts of
the ETF’s of Emerging markets (EEM) and BRIC (BKF) we see that both are sustaining well above support zones
that go back 5 to 6 years! The 40-week MA on both these ETF’s had been
flattish for years and have now started sloping up. Sustaining below the
support zones would be worrying but till then the scenario seems to be
positive.
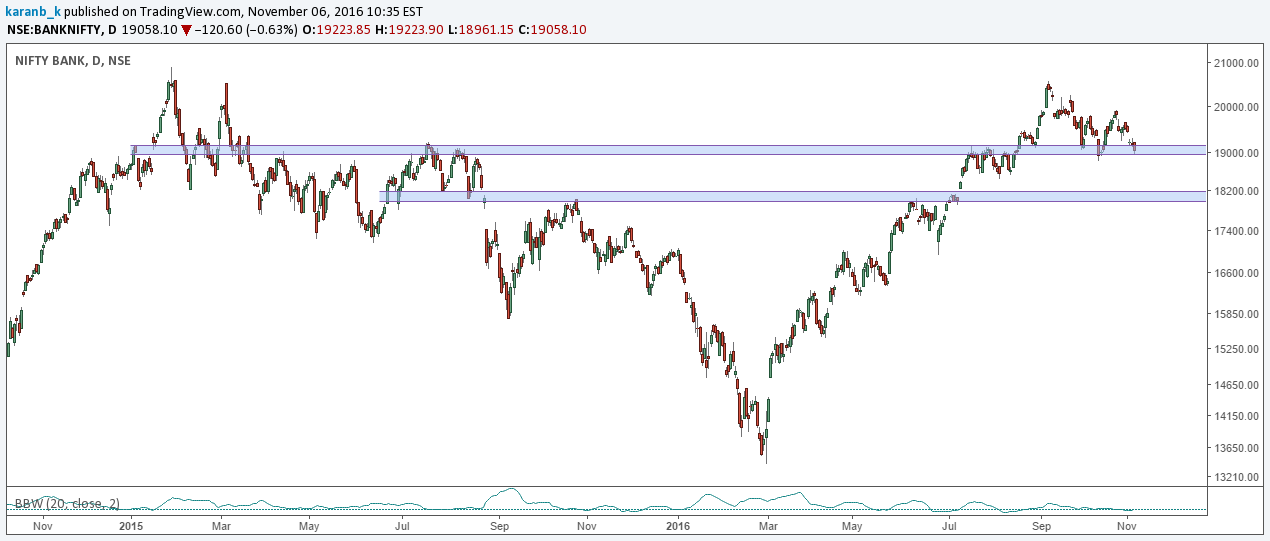
Chart
2 On the weekly charts the Nifty
index gave a bit of a scare last week but closed this week well above the
support zone. Drilling down to the smaller time-frame daily chart this price
action could be called a failed break-down but I am not so sure about that. Anyways,
other indices like Nifty 500, Midcap and
Smallcap indices are way above supports and even above the September expiry day
(surgical strike) highs. The broad strength still makes me lean to the
positive side and we have not seen any break-downs in the broader indices. Even
Bank-Nifty which has the highest weightage in the benchmark Nifty has showed
strength by closing above supports and previous week’s highs. The momentum based Nifty Alpha Index is
also in new all-time high territory!
Chart
3 this one had showed some warning signs but is back in positive territory now
- the average and median distance of
the sectoral indices compared to their highest 52 weekly closing. Both the
readings took a hard knock the week before and recovered this week. Current
readings are at -4.5% and -2.6%. I have not tested this but on a glance if the
readings stay below 8/10% for longer it has led to corrections in the benchmark
index.
Chart
4 On intermarket strength we still have
Metals, Realty and Auto in the lead. The defensive sector indices such as FMCG,
Pharma and IT are at the bottom ranks so RS ratios sorted by them being above
40 week moving averages suggests that there is no flight to defensives yet. Also,
if you refer to the page “Weekly Sector Relative Strength
Charts”
all broader indices are beating Nifty
and the 10 year bond index and most sector indices are beating the 10 year bond
index – not a negative from any angle! Since Metals, Auto and Realty have been
the leading indices on a relative basis, keep an eye on these indices for any
breakdowns – If they break past supports then would be a good time to evaluate
and take some risk off the table.
Chart
5 As for the broader trend, all
indices except IT are above their 40 week moving averages. Still supportive of
the bullish stance.
Chart
1:
Chart 2:
Chart 3:
Chart 4:
Chart 5: