Note : This is not a recommendation, these are just observations and an
assessment of the positives and negatives.
Nifty Weekly
What a week and all charts just
flipped!. Evidence has turned bullish for the Nifty index over the coming
months vis-à-vis bonds but Gold is still in the game for now.
Observations (charts below):
Positives:
On the daily
chart it is clearly visible that the 8k zone on Nifty had been visited several
times in the past and we have punched through that with ease. On the weekly
time-frame we have a positive crossover of the 10 & 40-week MA. MACD is
above 0 and RSI above 50 – as long as both these indicators have been above 0 &
50 there has been an upward bias as per past history.
After more than
a year the Nifty/Bond ratio is above its 40 week moving average and average of
momentum across time-frames has also turned in favour of Nifty. Also, the ratio
has improved for the broader Nifty 100, 200 & 500 indices.
Most of the broader
indices & sectoral indices are trading above their respective 40 week
moving averages. With reading above the 0 line there has been a positive bias
over next few weeks and months and when both these reading have hit the full
score we have seen major uptrends. Till that does not happen looks like we
might just be in for a range-bound scenario with moderate/low gains over next
few months.
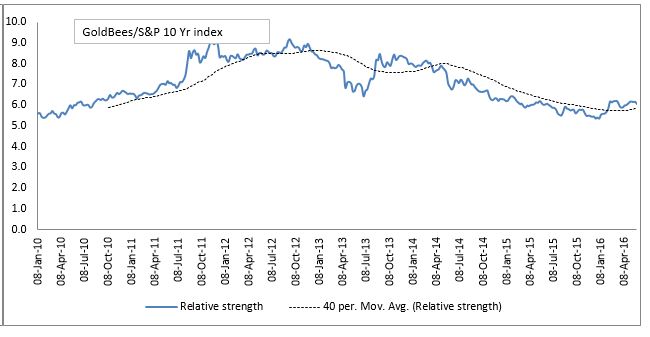
The Gold divided
by Nifty and 10 Year bond index ratios are still above their respective rising 40-week MA’s
indicating that Gold could be a potential outperformer over the coming months.
Risk to this view is if Gold falls below its respective 40-week MA.
Though the Nifty
has broken out but the Mid 100 & Small cap 100 indices are still stuck in
the previous range and are testing the upper boundary. From a relative strength
perspective these indices are lagging – the ratios of Mid/Nifty and Small/Nifty
are below their 40-week MA and had a breakdown this week. This suggests that
the rally is concentrated in the Nifty stocks and not yet spread to the Mid and
Small cap indices. (Refer Weekly Relative Strength Charts section for more
ratios).
The FII net long
index futures positions is at the highest for this year and as a percentage of
total open interest their net long position is at 51%.
Negatives: (there is always some bad news!)
Index PE ratio
is back above 1 standard deviation of its long term average and the last chart
is a comparison of Nifty and earnings rebased to 100 – the spread between these
two (indexed) as a percentage of indexed earnings is a tad below 100% and has usually
topped out above 100%. – of course earnings have been flat for a long time now
and if earnings improve so will the ratios.
To conclude – the weight of the evidence has shifted to the bullish
side with more positives. RISK to this would be the Nifty and Goldbees closing below their respective 40 week
moving average. A close below that moving average and I will be out.
Nifty Daily & Weekly chart :


Nifty/10 year bond ratio chart :

Broader Indices/10 year bond
ratio chart :

Indices above 40 week moving
average :

Gold relative to Nifty and 10
Year bond index :

Mid & Small caps :


FII Index Futures :

Index PE & Earnings :


