Note : This is not a recommendation and I am not a registered analyst,
these are just data points and an assessment of the positives and negatives
from a longer term point of view.
Nifty Weekly
Chart 1 Nifty is still near all-time
highs, above support and above rising 40-week MA.

Chart 2 Nifty & all indices
except Pharma & IT are above their 40-week MA.

Chart
3 Nifty total returns-Bond ratio is above its 40-week MA.

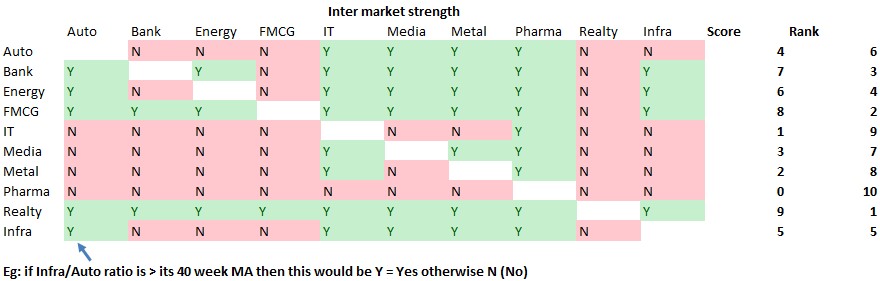
Chart
4 Longer term intermarket strength is in FMCG & Realty.
Chart
5 Avg. & Median distance of all sectors from their 52 week closing highs is
at -6% & -4%.

Chart
6 FII flows in Index futures segment is net long


