Note : This is not a recommendation, these are just observations and an
assessment of the positives and negatives.
Nifty Weekly
On a longer term time-frame a lot
of data sets still suggest to keep a bullish/positive stance on Nifty and Gold.
Observations (charts below):
Positives:
On the weekly
time-frame we have a positive crossover of the 10 & 40-week MA. MACD is
above 0 and RSI above 50 – as long as both these indicators have been above 0
& 50 there has been an upward bias as per past history. Also, a number of
other indices are exhibiting this same pattern hence supportive of overall
positive stance.
The Nifty/Bond
ratio is above its 40 week moving average and average of momentum across
time-frames has turned in favour of Nifty. Also, the ratio has improved for the
broader Nifty indices – even Mid & Small caps.
The broader
indices/Nifty ratio has improved across the board suggestive of a broad based
rally (refer weekly relative strength charts page above).
Most of the broader
indices & sectoral indices are trading above their respective 40 week
moving averages. IT & Pharma are weak and below their 40 week moving
average. With reading above the 0 line there has been a positive bias over next
few weeks and months and when both these reading have hit the full score we
have seen major uptrends.
Had discussed in
past few posts about keeping gold in the portfolio and that view still holds,
presently in Dollar terms the weekly charts of Gold & Silver are both
supportive of a positive stance. Apart from the usual crossover and MACD
readings, the weekly RSI reading has been highest since 2012 – indicative of a
possibility of a longer term uptrend.
On the shorter daily time-frame both
the Nifty & Bank-Nifty are still in their resistance zones, although the
broader Nifty500 has broken out above its Oct’15 highs. The Bollinger Bandwidth
on the Bank-Nifty is at its lowest level in years and with price at resistance
we have to let the price do the talking before anticipating a breakout/down.
The FII positioning
continues to be net long in the index futures segment and on the VIX projected
range the highest projected index reading comes in the 8600-8650 zone.
Negatives: (there is always some bad news!)
The Auto/FMCG
and Bank/FMCG weekly ratio charts are flattish and below their 40 week MA.
Though, a flat to uptrending ratio has been good for Nifty in the past
instances.
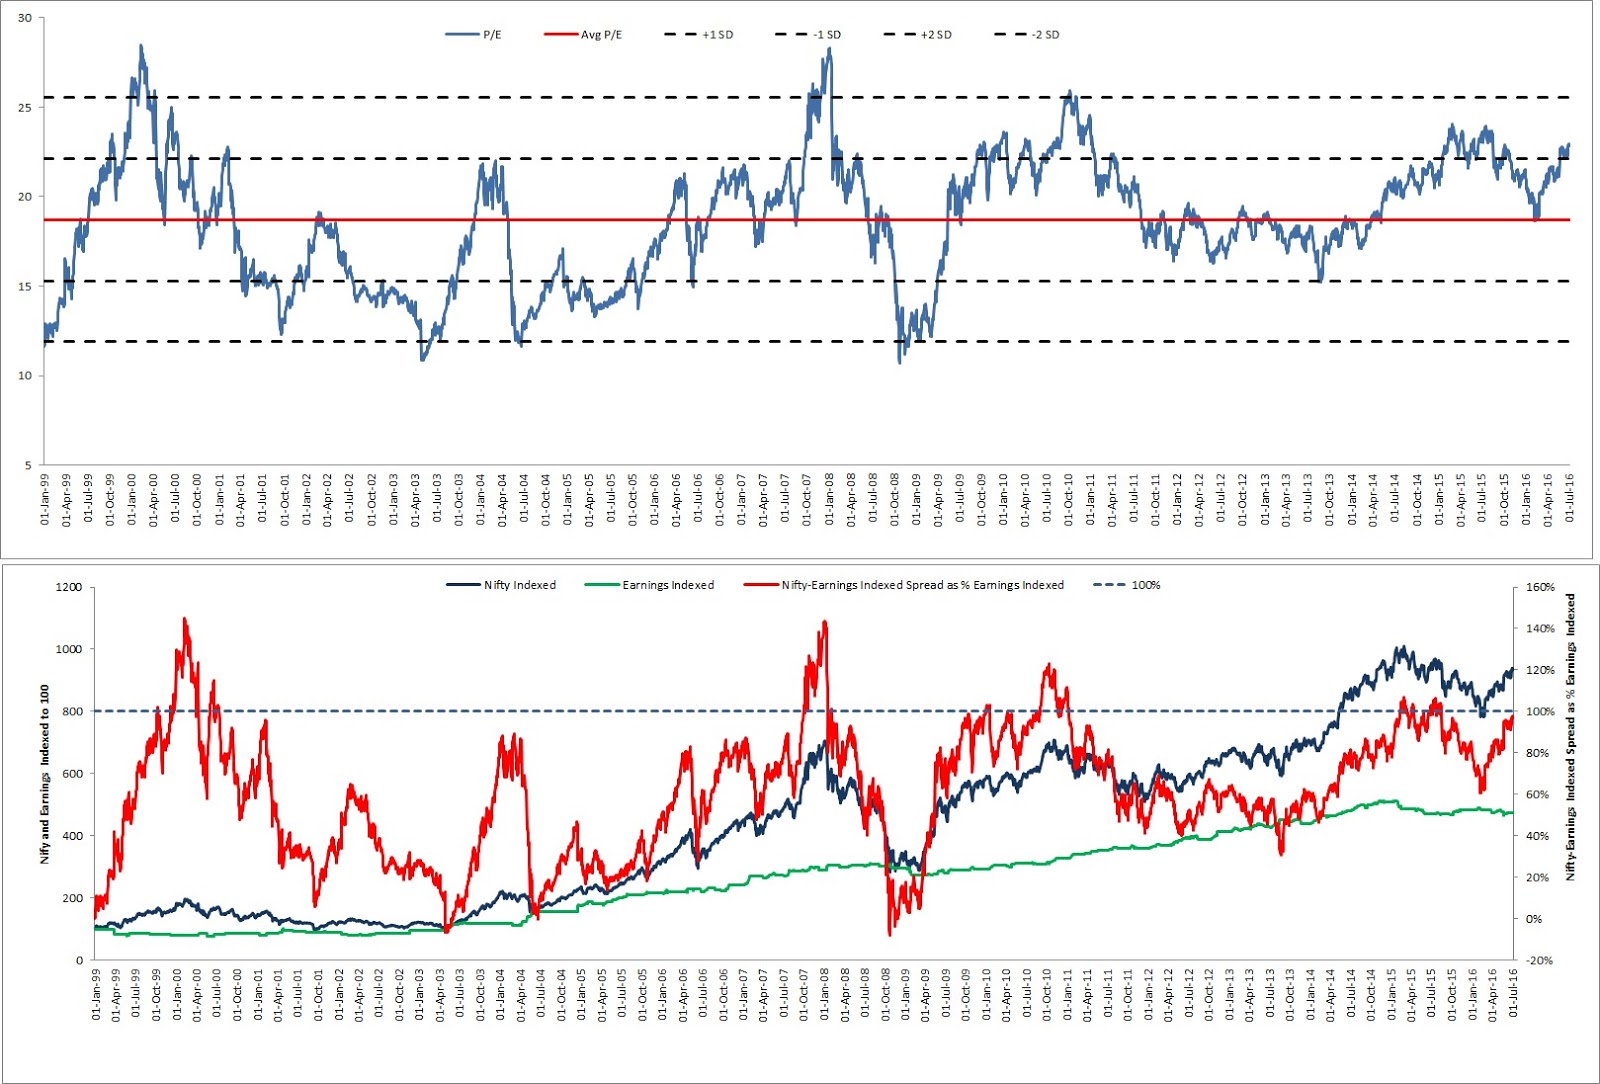
Index PE ratio
is back above 1 standard deviation of its long term average and the last chart
is a comparison of Nifty and earnings rebased to 100 – the spread between these
two (indexed) as a percentage of indexed earnings is a tad below 100% and has
usually topped out above 100%. – of course earnings have been flat for a long
time now and if earnings improve so will the ratios.
To conclude – the weight of the evidence is still on the bullish
side with more positives vs negatives. RISK’s
to this would be the Nifty and Goldbees closing below their respective 40 week
moving average. A close below that moving average and I will be out.
Nifty Weekly chart :
Nifty/10 year bond ratio weekly chart
:
Broader Indices/10 year bond
ratio weekly chart :
Indices above 40 week moving
average :
Gold & Silver ($) weekly
chart :
Nifty & Bank Nifty Daily chart
:
Nifty500 daily chart :
FII Index Futures :
VIX Projected range Daily chart :
Auto/FMCG & Bank/FMCG weekly
charts :
Index PE & Earnings :