Sunday 27 September 2015

Technicals for week ending – 27th September 2015

Nifty weekly
The 8100-8200 zone still proving to be a tough one to crack, in addition to this the negative crossover of the 10 & 40 week moving averages is still in play while the 40 week MA is pointing down – this does not bode well for equities from a longer term trend perspective.

Also, the weekly Nifty/bond ratio is still far below its 40 week MA which indicates a more positive outlook for bonds vis-à-vis Nifty.

Now we have the RBI event coming up early in the week but looking at the ratio charts of different sectors looks like the market is positioned defensively as only 4 sector ratio charts are above their 40 week moving average of which 3 are defensive's – Pharma, IT & FMCG.


Ratio charts of defensive sectors : 


Sunday 20 September 2015

Buy & Rotate


Similar to the 10 SMA strategy that I used before (Sector Technical Analysis: The Simple strategy - 10 SMA update - Aug'15
The above strategy also uses just 2 funds. The HDFC Nifty index fund and the HDFC Gilt Long term fund – both are growth options i.e. dividends are reinvested.
Rules:
·         Buy index fund if average of 1,3,6,9 month returns is greater than that of Gilt fund
·         Buy Gilt fund if average of 1,3,6,9 month returns is greater than that of Nifty index fund
·         This does not go into cash – we just rotate between stocks (Nifty) & bonds
The strategy has performed well over the last 10+ years outperforming a buy-hold and hope approach by a wide margin – and that too at half the drawdown of a buy & hold approach. Since this approach does not exit any market and move to cash, constant monitoring would be required because if even bonds start selling off then the returns would be diminished as there is no trend filet unlike the 10 SMA strategy.
Thanks for reading J


Sector Momentum Model Update


Updating our momentum model for the week ending 20th Sep 2015.

I first wrote about this model here Sector Technical Analysis: Sector Momentum Model


Technicals for week ending – 20th September 2015.

Nifty weekly

Not much change since last week’s post. This week’s rally brought us close to the resistance zone of 8100-8200. From a longer term trend perspective this would be important to monitor if we can rally past this zone, but the way it broke down from there in late August makes me sceptical. Also, the weekly Nifty/bond ratio is still far below its 40 week MA which indicates a more positive outlook for bonds vis-à-vis Nifty.

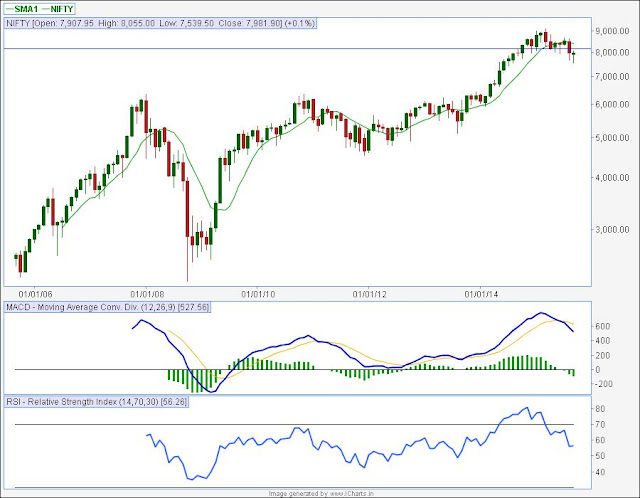
On the monthly chart we have a downward sloping 10 SMA along with a negative MACD – not a good combination for stocks in the past.


Sunday 13 September 2015

Sector Technicals for the week ending – 13th September 2015.

Nifty Weekly Technical Analysis:
Well, not much change since last week’s post but few developments –

1.       40 Week MA has turned down : from a longer term trend perspective it is not only bad that we are trading below this MA but that this MA turned down can signal a longer term down trend developing.
 
2.       Weekly RSI has turned up, so yeah we could get a bounce for a week or two.

3.       The CNX Mid cap, Small cap, Alpha Index & Low volatility index – all are trading below their 40 week MA’s.

4.       Of course all this analysis can go totally wrong but the number of negatives as highlighted in the last post and this are just too high. It will take a lot of hard work to overcome these negatives…until then.. in exit mode J  

Thanks for reading J


Saturday 12 September 2015

Sector Momentum Model Update

Updating our momentum model for the week ending 13th Sep 2015.

Only CNX Pharma & Media index remain above their 40 week MA & the Top 2 Eq. weight model is near its historical max draw-down levels.


I first wrote about this model here Sector Technical Analysis: Sector Momentum Model


Monday 7 September 2015

Sector Technicals for the week ending – 6th September 2015.

Nifty Weekly Technical Analysis:
On the weekly timeframe the Nifty has broken through multiple supports and that too with a gap around 8150-8200 zone. Well, there are many calling for a bottom but from my readings looks like this sideways-downward bias move might last longer. So on the weekly timeframe we have :

1.    Flattish 40 week moving average – could possibly signal that Nifty could be stuck in a range & be listless over next few months.
2.     MACD<0 & RSI < 50 – This combination has not been good for the markets in previous instances & RSI has broken below 40 too. Also, still no evidence of RSI divergence on the weekly charts. So it feels like we may be in for a protracted listless market.
3.    In relative terms the Nifty/Bond ratio has been in favour of bonds since April & this ration has broken below its 2010 highs.

On the Monthly chart – the index has closed below its 10 month SMA and MACD is in sell mode. These readings have not been good news for the markets in the past, agree that the sample size is small but better to be on the backfoot here !

Thanks for reading J


Weekly charts : 


Monthly charts :


Sector Momentum Model Update

Updating our momentum model for the week ending 6th Sep 2015.

Only CNX Pharma index remains above its 40 week MA & the Top 2 Eq. weight model is near its historical max draw-down levels.


I first wrote about this model here Sector Technical Analysis: Sector Momentum Model


Wednesday 2 September 2015