Note : This is not a recommendation and I am not a registered analyst,
these are just data points and an assessment of the positives and negatives
from a longer term point of view.
Nifty Weekly
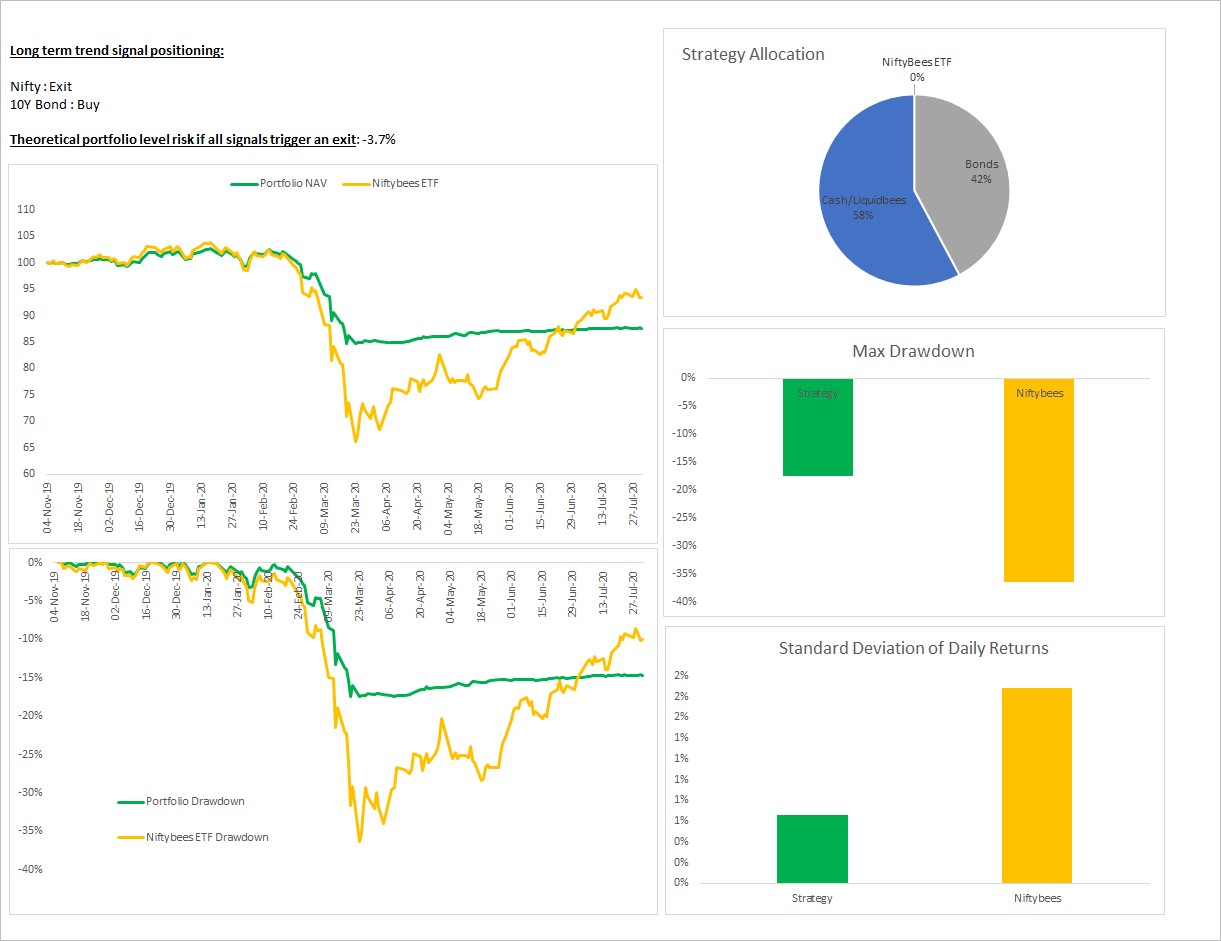
Chart 1. Strategy based on Nifty TRI
– is in exit mode and I am in liquid-bees. Bond strategy is still in buy mode
and I am holding a 10Y bond fund. Just amazed at this rally off the lows. Even
the other data points mentioned in the later charts have all turned super
bullish. Just unbelievable. On the strategy front, post June have been feeling
dumb since Nifty just overtook and now, Bonds - the saviour from earlier has
become a drag. Have to remind myself that in no way is this combination going
to always beat the benchmark and that is not the goal. The goal was to keep
portfolio drawdowns at a level that was personally acceptable and it did just
that when Nifty ETF experienced its max drawdown. Now, another side of
following these long term trend strategies – The Nifty strategy is close to
triggering a buy here. LOL!
If Green line in the first chart is up means buy mode and green line at 0 means exit mode.


Chart 2 Nifty total returns/10 year Bond index ratio is above its 40-week MA. Indicating longer term outperformance of Nifty vs Bonds.

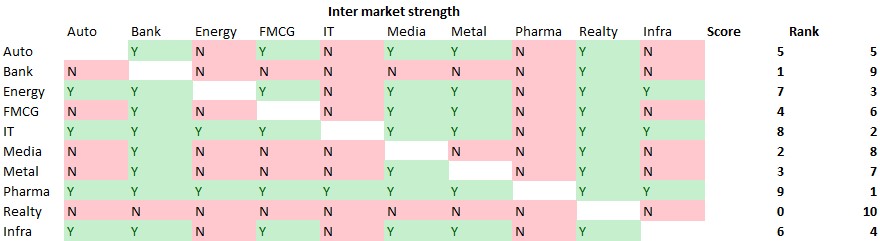
Chart 3 Longer term intermarket strength is in Metals, IT & Pharma. With Realty and Banks at the bottom.

Chart 4 9 of the broader indices are above their respective 40-week MA, and 8 of the sector indices are above its respective 40-week MA.

Chart 5 Avg. & Median distance of all sectors from their 52-week closing high is -11% and -5%.