Note : This is not a recommendation and I am not a registered analyst,
these are just data points and an assessment of the positives and negatives
from a longer term point of view.
Nifty Weekly
Chart 1. Strategy based on Nifty TRI
– is in exit mode and I am in liquid-bees. Bond strategy is still in buy mode
and I am holding a 10Y bond fund. If Green line in charts below is up means buy
mode and green line at 0 means exit mode. Portfolio return since 4th
November (go live) is -12.36% and current drawdown is 14.66% compared to Nifty
ETF return of -6.6% with a current drawdown of 10%.

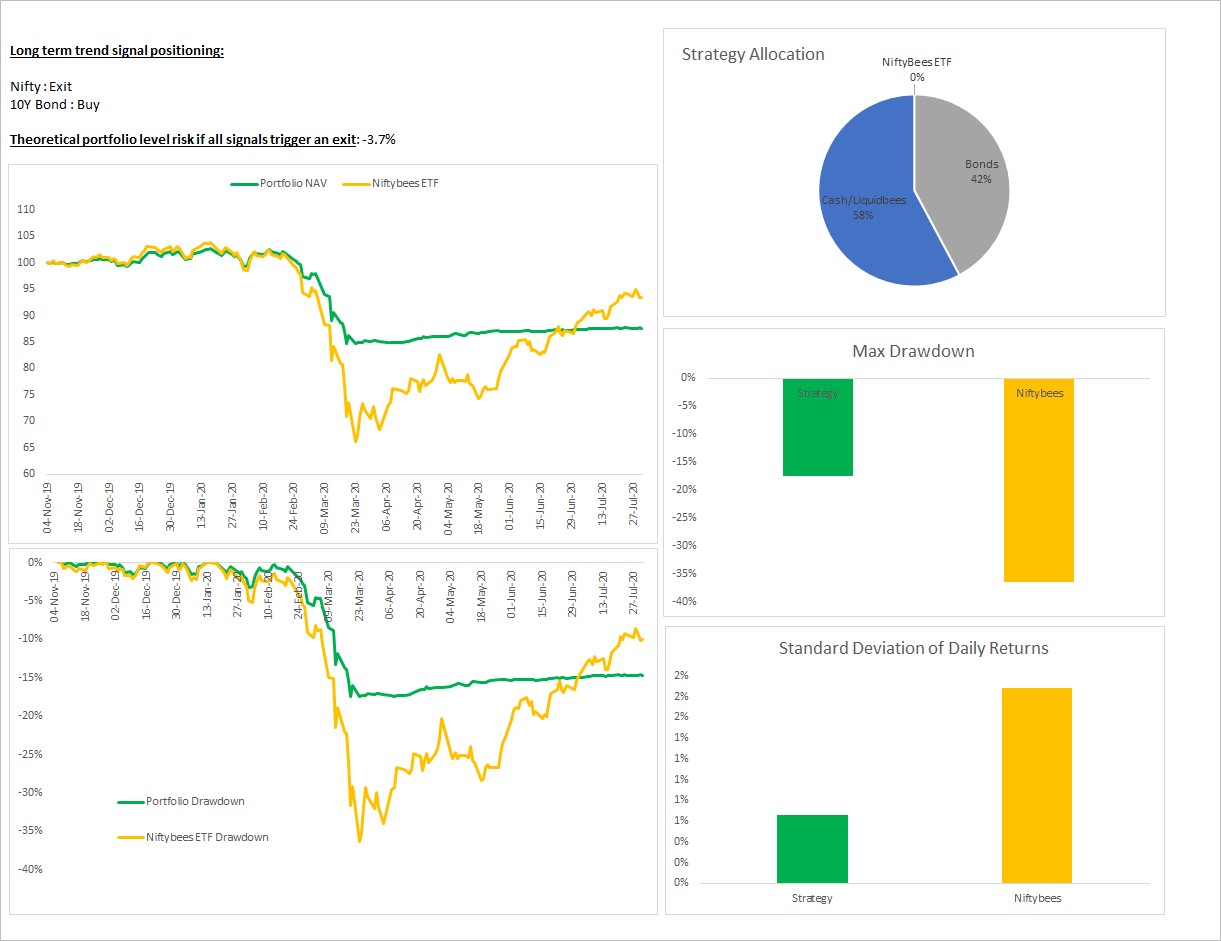
Chart 2 Nifty total returns/10 year Bond index ratio is BELOW its 40-week MA. Indicating longer term out-performance of Bonds vs Nifty.

Chart 3 Longer term inter-market strength is in Energy, IT & Pharma. With Realty
and Banks at the bottom.

Chart
4 8 of the broader indices are above their respective 40-week MA, and 6
of the sector indices are above its respective 40-week MA.

Chart
5 Avg. & Median distance of all sectors from their 52-week closing high is -16%
and -10%.

No comments:
New comments are not allowed.