Note : This is not a recommendation and I am not a registered analyst,
these are just data points and an assessment of the positives and negatives
from a longer term point of view.
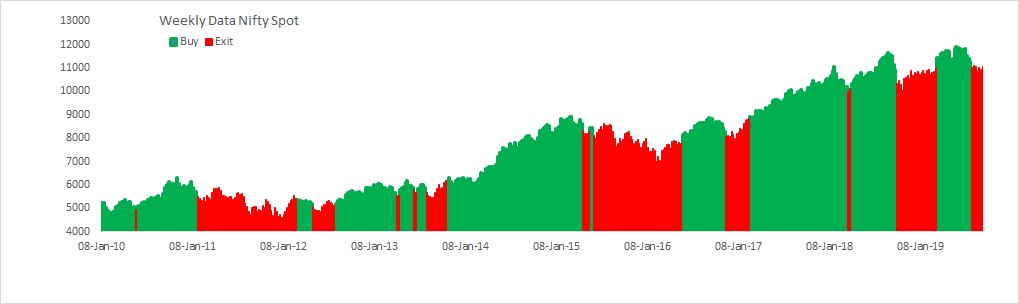
Nifty Weekly
Chart 1. Longer term trend model
based on weekly prices is in sell mode and I am holding Liquidbees at the
moment. Given the turnaround in sentiments on Friday, feels stupid being in
exit mode but that’s how systematic trading/investing is and I know that it
will take quite a while before the model turns bullish..so have to keep waiting
now for the signal.

Chart 2 Nifty total returns/10 year Bond index ratio is BELOW its 40-week MA &
momentum has shifted to bonds, both indicating longer term outperformance of
bonds vs Nifty.

Chart 3 Longer term intermarket strength as per the RS matrix is in Realty, FMCG
& Banks. With Metals and Media at the bottom.

Chart
4 A turnaround on this chart, 4 out of the broader indices are now
above their respective 40-week MA, and 3 of the sector indices are still above
their respective 40-week MA. One can see that Nifty returns have generally been
flattish to negative at such readings.

Chart
5 Avg. & Median distance of all sectors from their 52-week closing high is
at -14% & -9%.