Nifty Weekly Technical Analysis:
The Nifty lost close to 4% last
week. That too after a rate cut – going down on good news – Mr. Market is
telling us something here. Last week’s bullish data points have completely
changed to bearish mode. We have closed beneath an important support zone of
8180. The last few times this zone held well (blue arrows). BUT this time it’s
a big red candle with no lower shadows, looks like price action is signalling
that the downtrend has some more legs to go. There can be some back and forth
around this area but looks like 8500-8600 has established itself as the medium to
long term resistance. Nifty has closed below 40 week MA, the MACD line is close
to 0 and in the past, returns below 0 reading have been volatile and mostly
negative. The RSI is below 50 and combined with MACD it is not a pretty
picture. FII derivatives data for 5th is not available but going by
the data for 4th they have reduced net longs by a significant
amount. Looks like it’s better to wait on the side-lines or switch to bonds.


Sector Technicals:
CNX Midcap and Smallcap: Both the indices reverted from their resistance
zones. Technically both might see some more selling pressure/ moderate returns
due to the combination of a sell trigger on the MACD and RSI below 50. Small
caps look more vulnerable at this point for a sell off as they are below their
40 week MA. Would be prudent to increase longs only above the resistance bands
and if we get a but trigger from the MACD.


CNX Auto: The setup for
the Auto space looks negative too. MACD = sell, RSI <50, Auto index < its
40 week moving average – these 3 are not pointing out to a positive outlook for
the coming few weeks. The index closed right at supports. Better to take longs
only if we can sustain a few weeks above this support and see some improvement
on the MACD and RSI indicators.

Bank Nifty: Banks were the biggest loser last week, technically the
picture is negative – same as the Auto index as per the indicators. Price
action wise we are just at supports, so yes there can be a bounce back for a
day or 2 but on a weekly timeframe things look negative.

CNX Pharma: As mentioned before, the 13000 level holds the key for
a sustained uptrend, better to reduce longs or wait to increase long exposure
for some time till we get 2 weeks of continuous closing above the 13000 mark.
RSI is below 50 after a long time and once we lose support things would get
ugly.

CNX FMCG: Still not a pretty picture for the FMCG index as it is
below the 40 week MA. The index lost support of 20000. Better to wait and
watch. Looks likely that this space is going to be range-bound for the near
term. Longer term the picture looks negative as the MACD line is negative and
also in sell mode along with a RSI <50. This combination is a serious
negative.

CNX IT: As mentioned before, better to wait and watch the IT space
as it was right between supports and resistance and also its 40 week MA. Now,
we are below all those levels with a negative MACD and RSI below 50.

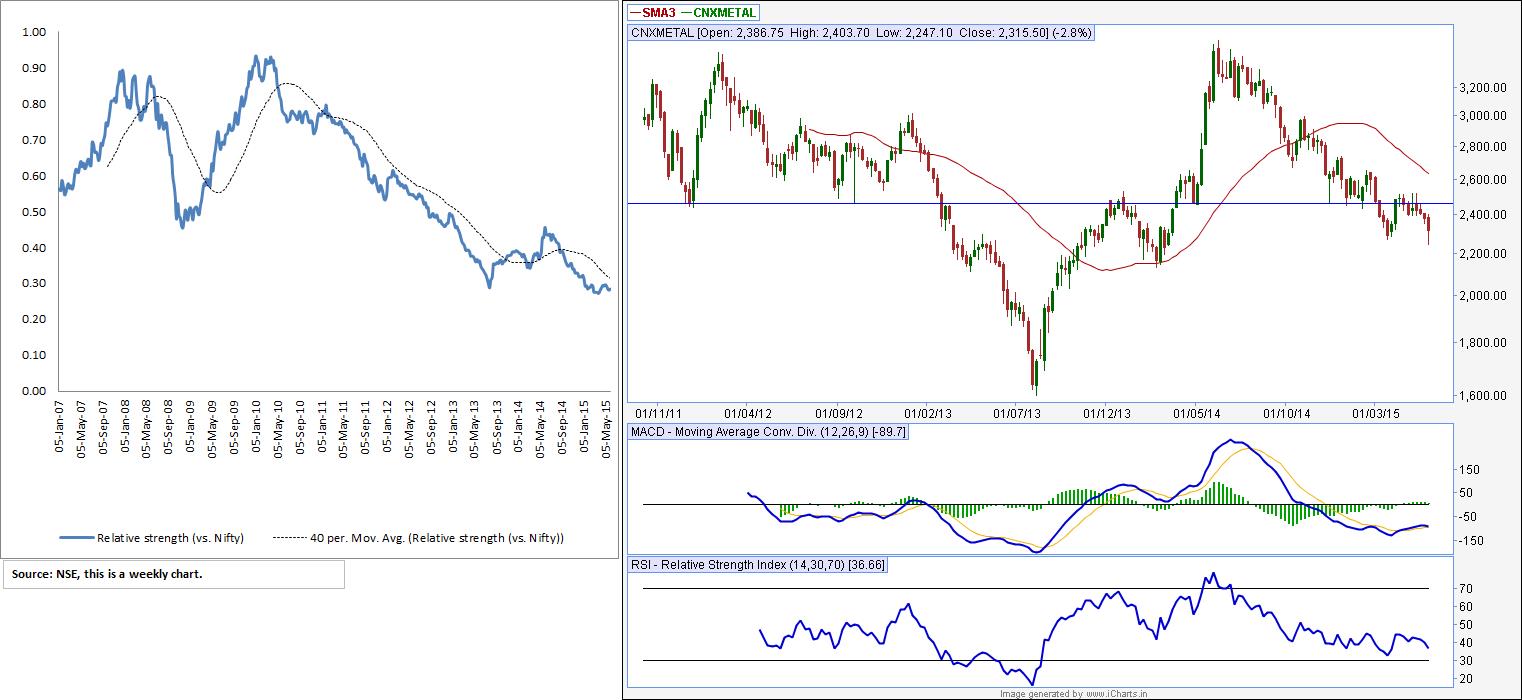
CNX Infra, Metal, Energy & Realty: As mentioned last week, out
of the 4 indices Infra looks the best from the long side but still better to
wait or use less exposure. There could be a tradable bounce in the Energy space
but for longer term better to wait for a move above the 40 week MA and a
positive crossover of the 10 and 40 week MA’s. Expect Metals and Realty to
underperform.


The below table is just a scan
that I run to check the overall trend of an index and its performance vs. the
benchmark Nifty. For more information on relative strength please click on the
Relative Strength section above.

No comments:
Post a Comment