Nifty Weekly
On a weekly timeframe the Nifty
index managed to close around 7600 which is also a major resistance zone as can
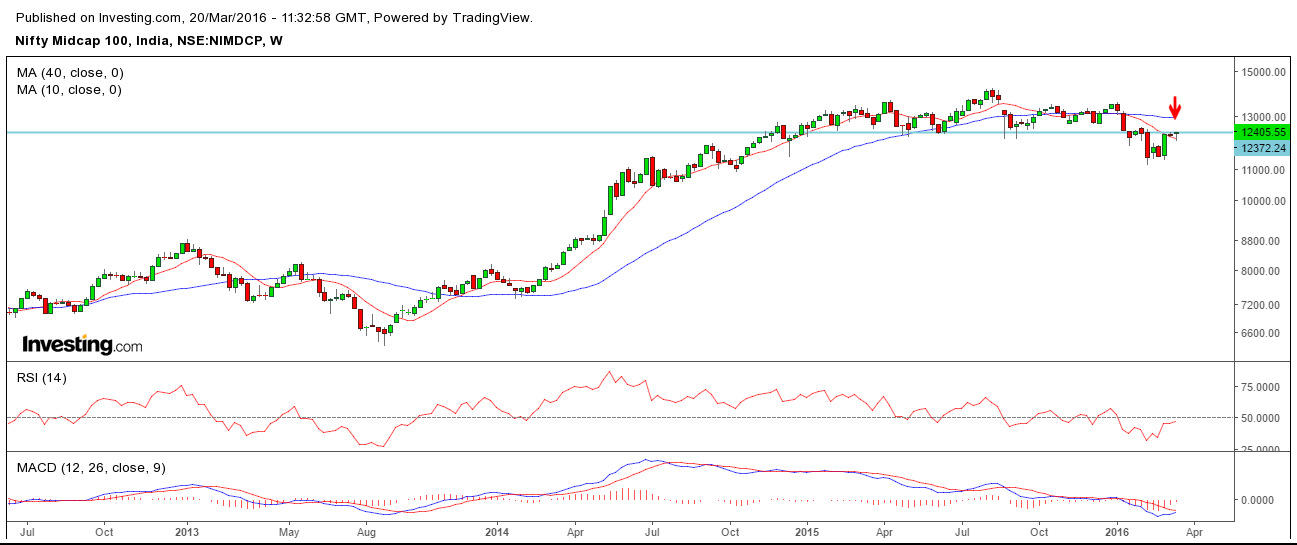
be seen in the below charts (red arrow). However, the Bank-Nifty and the Midcap
indices have yet to give a close above their resistance zones, the small cap
index is flattish and also close near its resistance. If these indices also
manage to gain and close above their resistance zones, then we may see a
sustained rally but for now this remains
a key risk.
On the weekly relative strength
charts (http://goo.gl/3MmshX) the broader
indices RS charts are still below their 40-week MA’s and most are seeing
downticks except the Bank index – indicating that the rally was driven by Nifty
index stocks. We are seeing some improvement in sector relative strength –
specially the 2 most beaten down sectors – Energy & Metals. The Nifty/Bond
index has improved but still below its MA’s indicating a preference for bonds
and even the 26-week rate of change between Nifty & bonds is showing an
outperformance for bonds.
On a shorter timeframe the bias remains positive as FII buying in
index futures is around its highest levels for the year so far and on the daily
timeframe the 14 period RSI is above 60. However, the key risk is the one
mentioned previously and we need to sustain for few days above the resistance
zones on Nifty as well as the Banking index for a confirmation for further
bullishness.
Nifty weekly chart :

Bank Nifty weekly chart :

Nifty Midcap weekly chart :
Nifty Smallcap weekly chart :

Nifty/10 year bond ratio chart :

Indices above 40 week moving
average :

No comments:
Post a Comment